Predicted probabilities
Predicted probabilities
As you may have already realised, log-odds are not straight-forward. This is why we use the predict() function which give us predictions for Y, the dependent variable.
probabilities<-predict(logit.model,type = "response")The effects package
The final section include’s the use of the effects package developed by Fox, et al. The effects package creates plots for various statistical models. In this example I will show you how it works with a logistic model- but it works with linear models, mixed effects models and many other.
First you have to install the effects package. The easiest way to visualise your model is by using the allEffects() function in combination with the plot() function.
library(effects)
plot(allEffects(logit.model))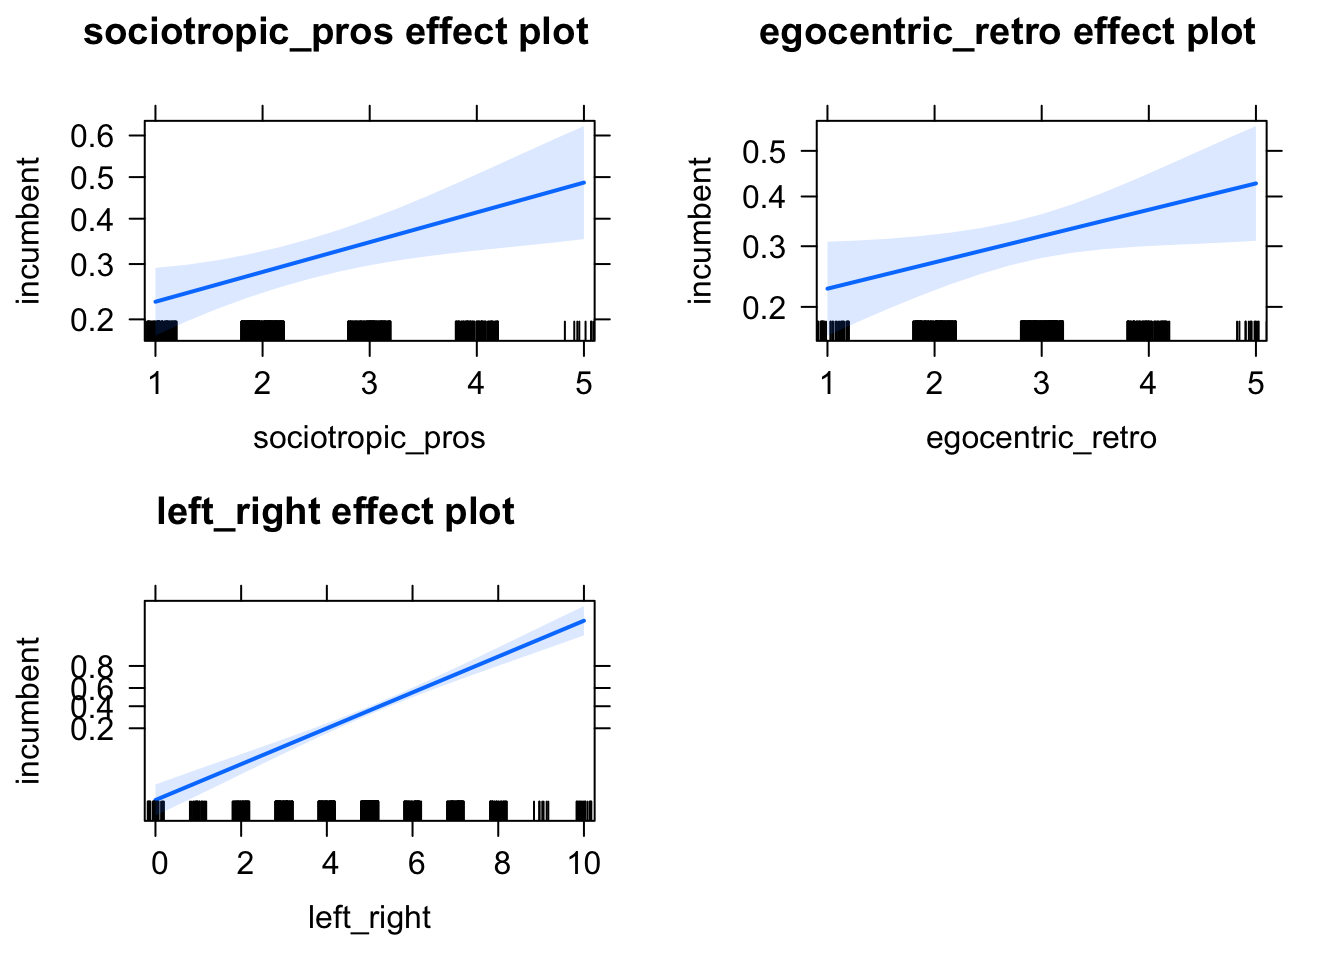
References
Fox, J. (2003) Effect displays in R for generalised linear models. Journal of Statistical Software 8:15, 1–27, http://www.jstatsoft.org/v08/i15/.