Categorical variables
Some variables, consist of named categories, e.g. the name of your favourite brand. A category-variable, or a categorical variable refers to any variable that puts individuals into categories. These variables are also called nominal variables. The word nominal comes from Latin (nominalis=of a name), because we are giving names to the values of our variable.
With categorical variables we want to understand the frequency with which each value appears in our dataset. As you already know the easiest way to do so is by producing a table. Remember the table () function. The appropriate measure of central tendency for categorical variables is the mode and/or the median.
Below we will learn some basic data manipulation for categorical variables. Starting with identifying the class() of a variable before we move to assigning a new name to variable and to the values of a categorical variable.
There are numerous data types in R. The most frequent used ones are numeric, character (string) or factor, and logical (TRUE or FALSE). To check the type of data contained in a variable we can use the class() function.
load("EVS_UK.RData")To find the length of a character variable we use the nchar() function.
EVS_UK$education<-EVS_UK$v243_r_weight
table(EVS_UK$education)
##
## 1 2 3
## 590 313 885As you know, education is a classic example of a categorical variable. How can we assign labels to the values of the variable? This is easy.
Note that as the same time we will learn how to covert a variable to factor but also we will give a name to the values.
Let’s do it!
EVS_UK$education <- factor(EVS_UK$education,
                         levels = c(1, 2, 3),
                         labels = c("Low", "Medium", "Upper"))
table(EVS_UK$education)
##
## Low Medium Upper
## 590 313 885Let’s examine our new factor variable with a frequency table
table(EVS_UK$education)##
## Low Medium Upper
## 590 313 885The most common graphical representation of categorical variables is bar graphs and pie charts.
library(ggplot2)
ggplot(data.frame(EVS_UK), aes(x=education)) +
  geom_bar()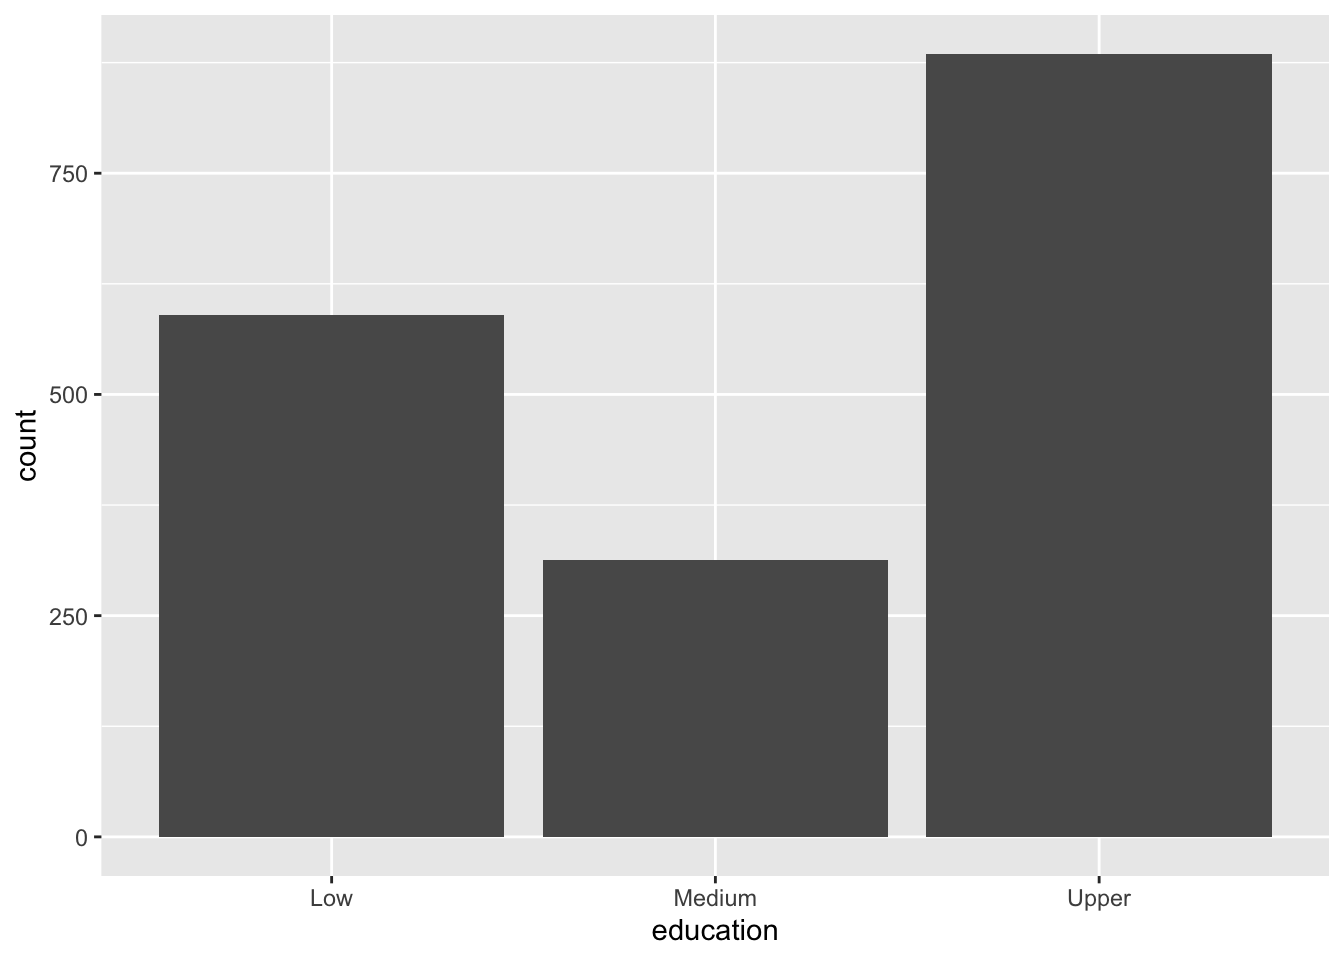
Adjust the width of the bars using the width function, change the appearance of the axes by giving labels. Give a title to your graph. RStudio Base cheatsheet