Graphs-ordinal variables
Learning Objectives
By the end of this section you should be able to:
- Plot ordinal variables using ggplot2
- Change or adjust the labels of a variable
- Use the density plot to represent ordinal variables.
In this section we will use two variables describing anti-immigration attitudes, the first one is called v184 and is asking respondents to agree or diagree with the following statement “Immigrants take away jobs”. The second variable is called v186 and is asking respondents whether “Immigrants are responsible for crime”.
names(EVS_UK)[names(EVS_UK) == "v184"] <- "immi_jobs"

table(EVS_UK$immi_jobs) # This is to check whether the function was correctly specified
##
## 1 2 3 4 5
## 71 197 631 610 272We may add labels to the values using the functions we used at section 1:
If you only want to rename the name of the variable the easiest way is by using the names() function.
EVS_UK$immi_jobs <- ordered(EVS_UK$immi_jobs,#here you specify that this is ordered variable
levels = c(1,2,3,4,5), # here you specify the values of the variable
labels = c("Completely agree", "Agree", "Neither/nor","Disagree", "Completely disagree" ))  #here you specify the names of the values

table(EVS_UK$immi_jobs)
##
## Completely agree Agree Neither/nor Disagree
## 71 197 631 610
## Completely disagree
## 272We will do the same for the variable describing whether “Immigrants tare responsible for crime”.
EVS_UK$immi_crime <- ordered(EVS_UK$v186,#here you specify that this is ordered variable
levels = c(1,2,3,4,5),# here you specify the values of the variable
labels = c("Completely agree", "Agree", "Neither/nor","Disagree", "Completely disagree" ))  #here you specify the names of the values

table(EVS_UK$immi_jobs)
##
## Completely agree Agree Neither/nor Disagree
## 71 197 631 610
## Completely disagree
## 272plot3<-ggplot(na.omit(EVS_UK), aes(x = immi_crime),na.rm = TRUE) + geom_bar() + facet_grid(gender ~.)+
theme_classic() #The na.omit() function will remove NAs
plot3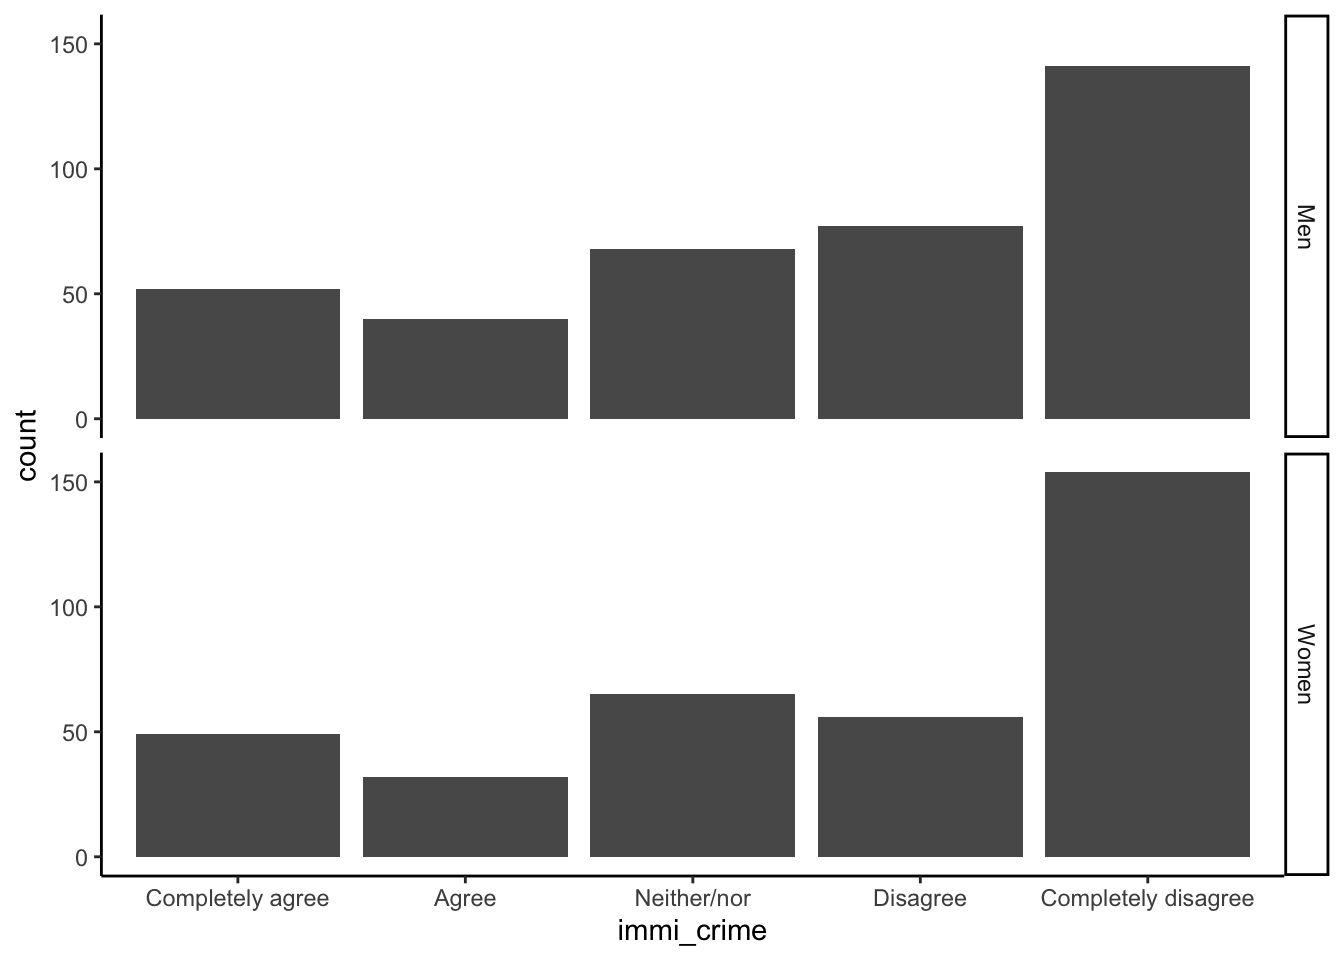
Density Plots
plot4 <- ggplot(na.omit(EVS_UK), aes(immi_crime))

plot4 + geom_density(aes(fill=factor(gender)), alpha=0.5) +
    labs(title="Density plot",
         subtitle="Anti-immigration attitudes by gender",
         caption="Source: European Value Study",
         x="Anti-immigration attitudes",
         fill="Gender")+
  theme_classic()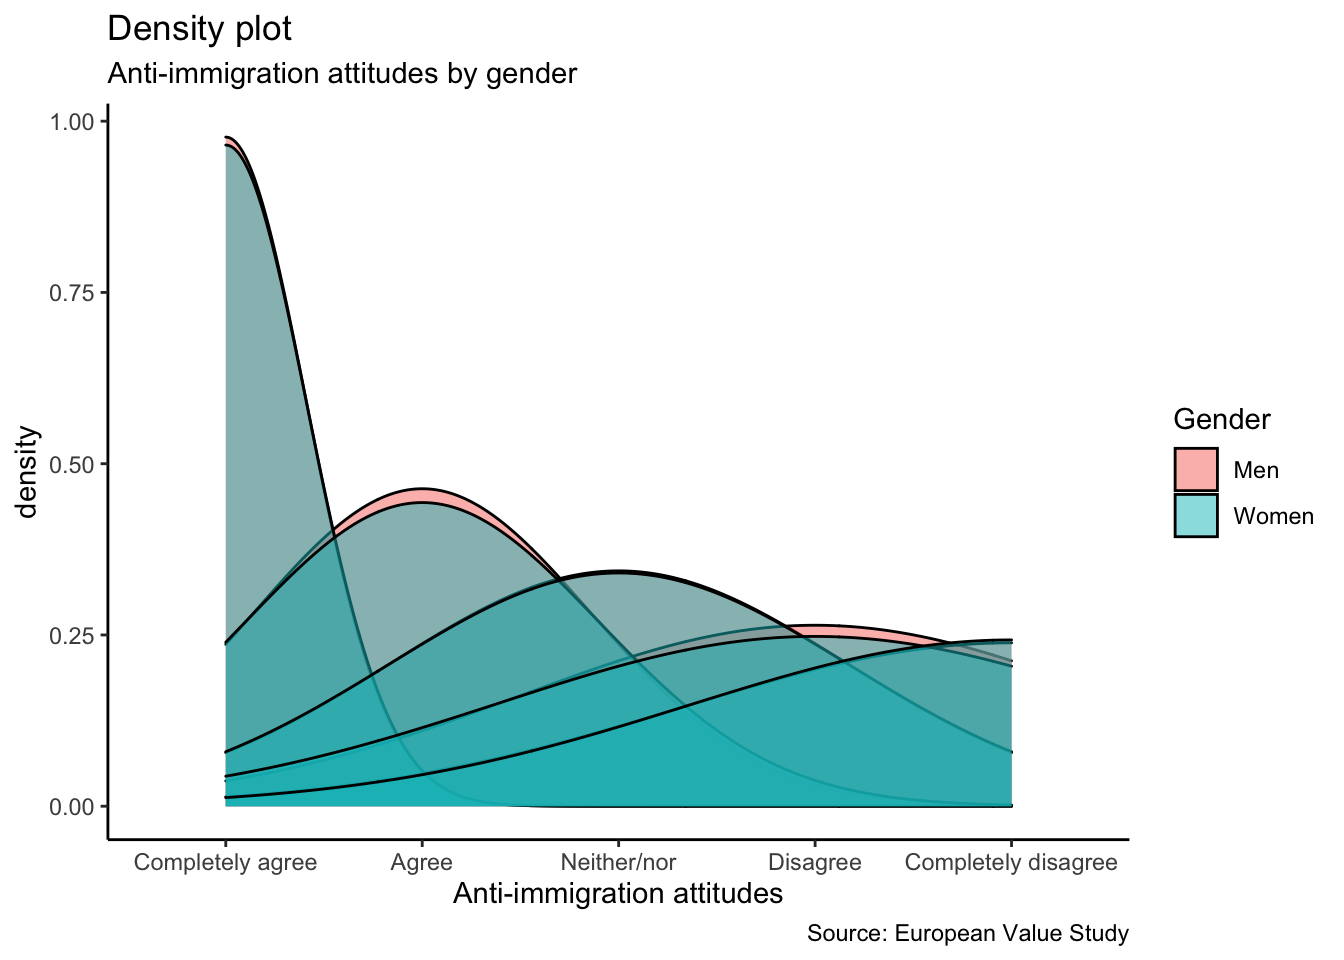
Recap
- You can plot ordinal data using
geom_density()in ggplot2. - You can adjust or rename the ordinal data using the
ordered,levelsandlabelsfunctions in R.