Construct and plot your interaction term
The \(:\) designates the interaction between two variables. The operator \(*\) designates the interaction between the two variables, plus the main effects. In our model we included an interaction term between two variables born.country and east_west.
model.1<-lm(immi.jobs~ born.country*east_west+country.ancestry+share.cultr+left_right+education,data=EVS.Germany)
summary(model.1)
##
## Call:
## lm(formula = immi.jobs ~ born.country * east_west + country.ancestry +
## share.cultr + left_right + education, data = EVS.Germany)
##
## Residuals:
## Min 1Q Median 3Q Max
## -5.2222 -1.6097 -0.4451 1.4351 7.6519
##
## Coefficients:
## Estimate Std. Error t value Pr(>|t|)
## (Intercept) 0.7978867 0.2726768 2.926 0.00348 **
## born.country 0.4542258 0.0891563 5.095 3.92e-07 ***
## east_west 0.7637056 0.2591249 2.947 0.00325 **
## country.ancestry 0.2614679 0.0919001 2.845 0.00450 **
## share.cultr 0.3965076 0.0850157 4.664 3.37e-06 ***
## left_right 0.1654872 0.0338321 4.891 1.11e-06 ***
## education -0.0017670 0.0003333 -5.301 1.32e-07 ***
## born.country:east_west -0.2885010 0.1428949 -2.019 0.04366 *
## ---
## Signif. codes: 0 '***' 0.001 '**' 0.01 '*' 0.05 '.' 0.1 ' ' 1
##
## Residual standard error: 2.279 on 1544 degrees of freedom
## (3855 observations deleted due to missingness)
## Multiple R-squared: 0.1577, Adjusted R-squared: 0.1539
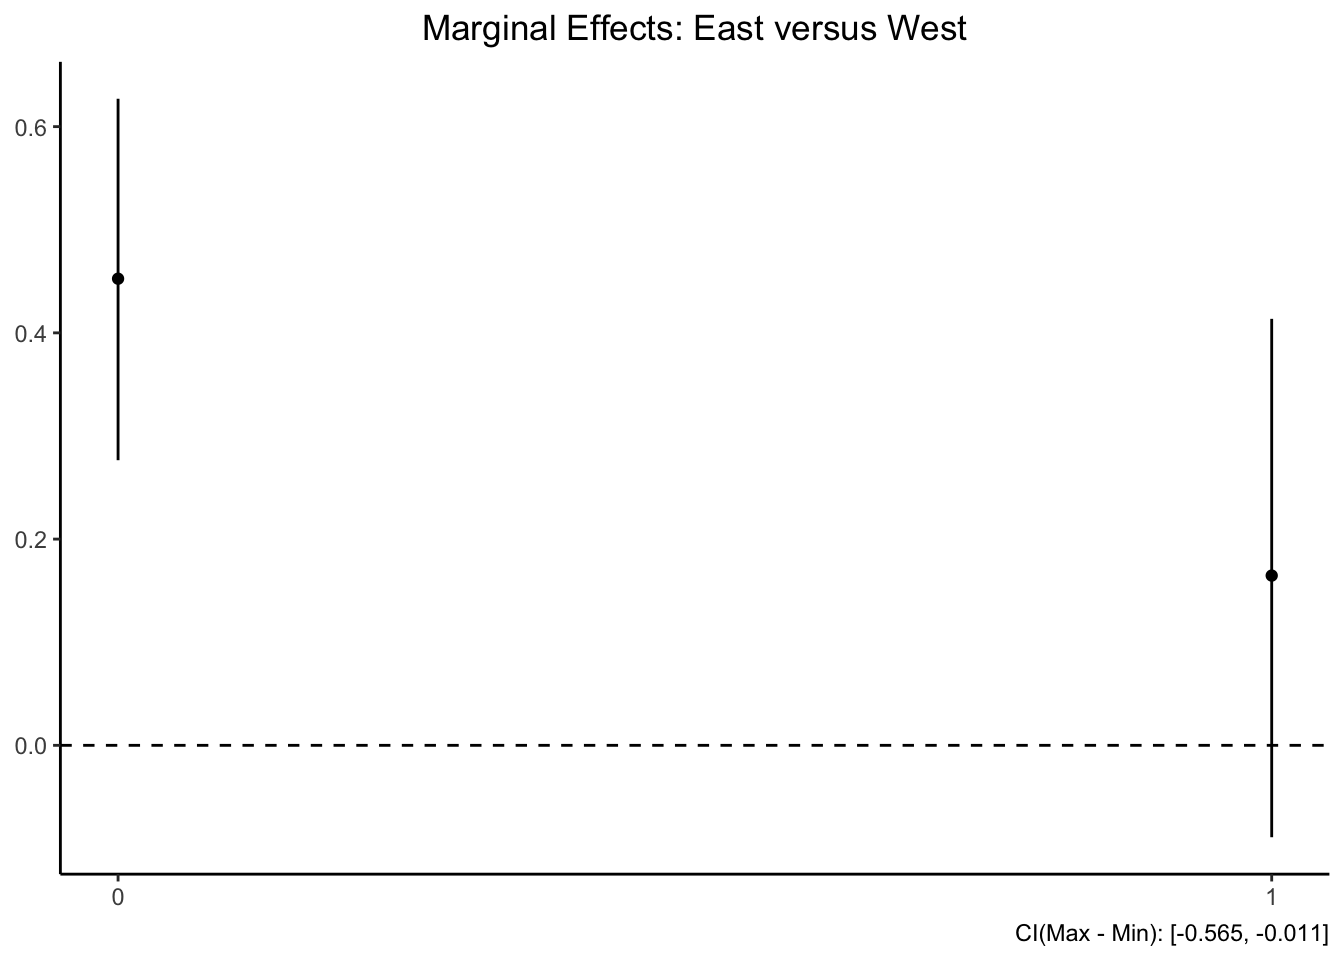
## F-statistic: 41.3 on 7 and 1544 DF, p-value: < 2.2e-16It is important to plot the outcome of the interaction term. To do so you may use the interplot() package.
library(interplot)
interaction<-interplot(m = model.1, var1 = "born.country", var2 =  "east_west") +
  theme_classic() +
  theme(plot.title = element_text(hjust = 0.5))+ # This will center the title of your plot
  geom_hline(yintercept = 0, linetype = "dashed") +
  ggtitle("Marginal Effects: East versus West")

interaction